Mule & ELK Part 3 - Sending Mule Logs to ELK with Filebeat
![]()
![]()
This post is the third part from a series of posts:
Part 1 - Introduction to ELK Stack with Mule of this series explained what ELK is and a high level view of the options. This post will explain how to send Mule logs to ELK using Log4j2 appenders and a socket in Logstash which will work for both CloudHub and on-premise runtimes.
Part 2 - Sending Logs via Log4j2 explains how logs can be sent to ELK from CloudHub via Log4j2.
This post continues the series and looks at how we can configure Filebeat to send Mule logs into ELK.
When to use Filebeat?
Filebeat is an agent that runs on your servers/VMs where the log files are being wrote to. It is configured to monitor log files (in our case Mule files) as desired and then forwards them onto various platforms (in our case ELK).
In the context of MuleSoft Filebeat is best (and can only be) used for on-premise (customer hosted) runtimes as it requires direct access to the VM and hard disk that Mule is running on. CloudHub does not allow this level of access and from a customer perspective we can’t see the actual log files on the disk so Filebeat cannot be used in this context.
Setting up Filebeat
The following instructions provide the basics of configuring Filebeat to send Mule logs to an Elasticsearch instance. These instructions are not appropriate for a Production environment.
The steps are appropriate for quickly sending logs out of a Dev/Test environment or for a proof of concept but further work, design & engineering would be required to use this in a Production environment. This includes considerations around; error handling (what happens when logs fail to send), parsing the logs, sending the correct logs, proper indexing in Elasticsearch and ensuring the platform highly available. This guide will send the logs directly from Filebeat to Elasticsearch but you may want to use Logstash (like we did in Part 2) which will make it easier to parse & transform the logs before sending them to Elasticsearch.
The good news is that configuring Filebeat does not require any changes in configuration to the Mule runtime or any specific code in the Mule applications (other than your normal loggers!) for Filebeat to work.
The complete installation/setup guide can be found here. The following are the key steps required, with Mule specifics.
1. Installation
Download & Install Filebeat on the same server as your Mule Runtime. For CentOS or RHEL the commands to install the Filebeat service are:
curl -L -O https://artifacts.elastic.co/downloads/beats/filebeat/filebeat-7.10.0-amd64.deb
sudo dpkg -i filebeat-7.10.0-amd64.deb
2. Configure the Output - Elasticsearch
This step tells Filebeat where to send logs to.
In our case we are using an Elasticsearch instance but this could be a range of different options including Logstash.
Edit filebeat.yml in /etc/filebeat/filebeat.yml to include the following:
output.elasticsearch:
  hosts: ["myEShost:9200"]
  username: "filebeat_internal"
  password: "YOUR_PASSWORD"
This would send logs to an Elasticsearch hosted at “myEShost:9200”. Username & passsword can be removed if they are not configured on the ES instance.
3. Configure the Input - Mule Logs
Next we tell Filebeat where to pick logs up from.
Filebeat has a collection of modules which are pre-built configurations for reading logs from applications such as ActiveMQ, Tomcat, Nginx and many more. Mule is not one of the pre-built modules so we need to use a manual configuration for this which is simple!
Edit filebeat.yml in /etc/filebeat/filebeat.yml to include the following:
filebeat.inputs:
  - type: log
    enabled: true
    paths:
      - /home/ec2-user/mule/mule-enterprise-standalone-4.3.0/logs/hello-world.log
Under paths you can use wildcards and add multiple paths depending on your use case.
4. Run Filebeat
The first of the last 2 commands creates the index in Elasticsearch (defaults to “filebeat-*”) and creates default dashboards in Kibana. The last command starts Filebeat as a service which will then monitor the log files for changes and send them to Elasticsearch.
filebeat setup -e
service filebeat start
5. View the Logs!
You should then be able to see & filter the logs in Kibana!
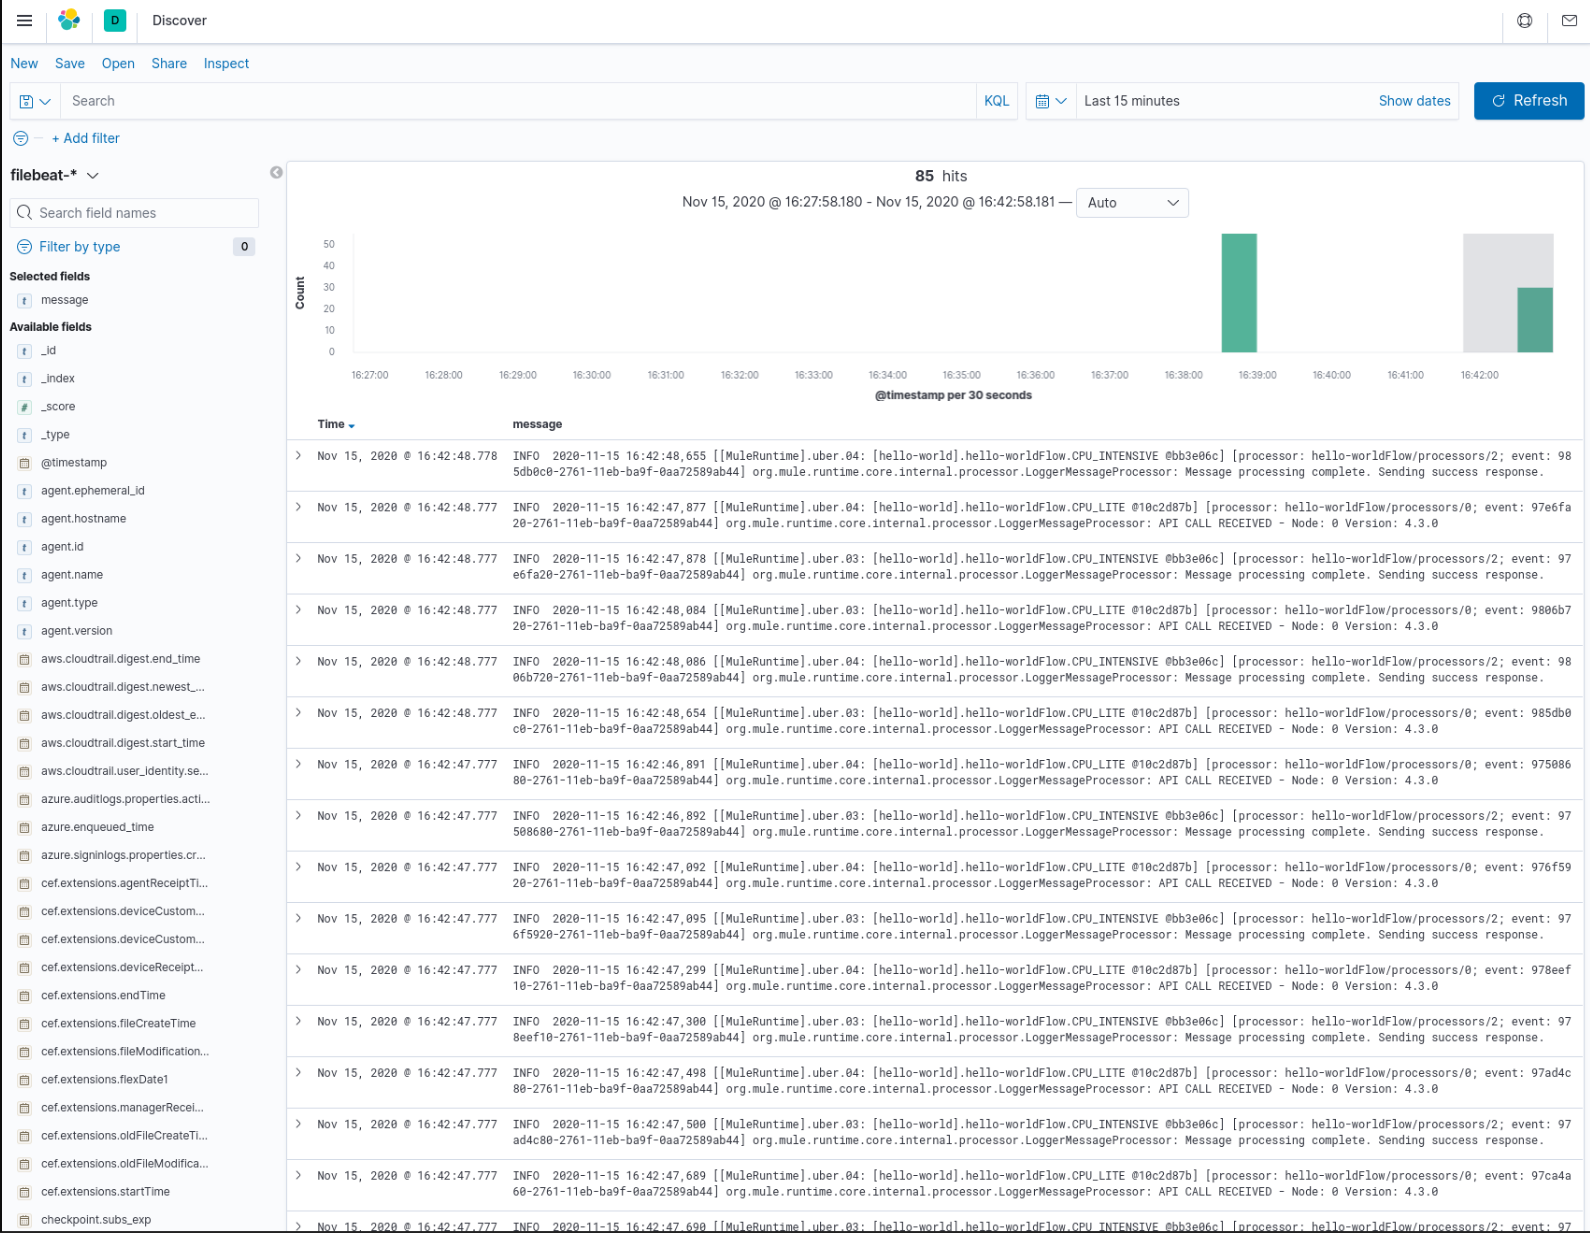
Note that Filebeat by default adds many fields to the output - you are probably most interested in the “message” field so in Kibana click add and then you will see the application log messages. You could then use Logstash or further Filebeat configuration to control the fields that are sent to Elasticsearch.
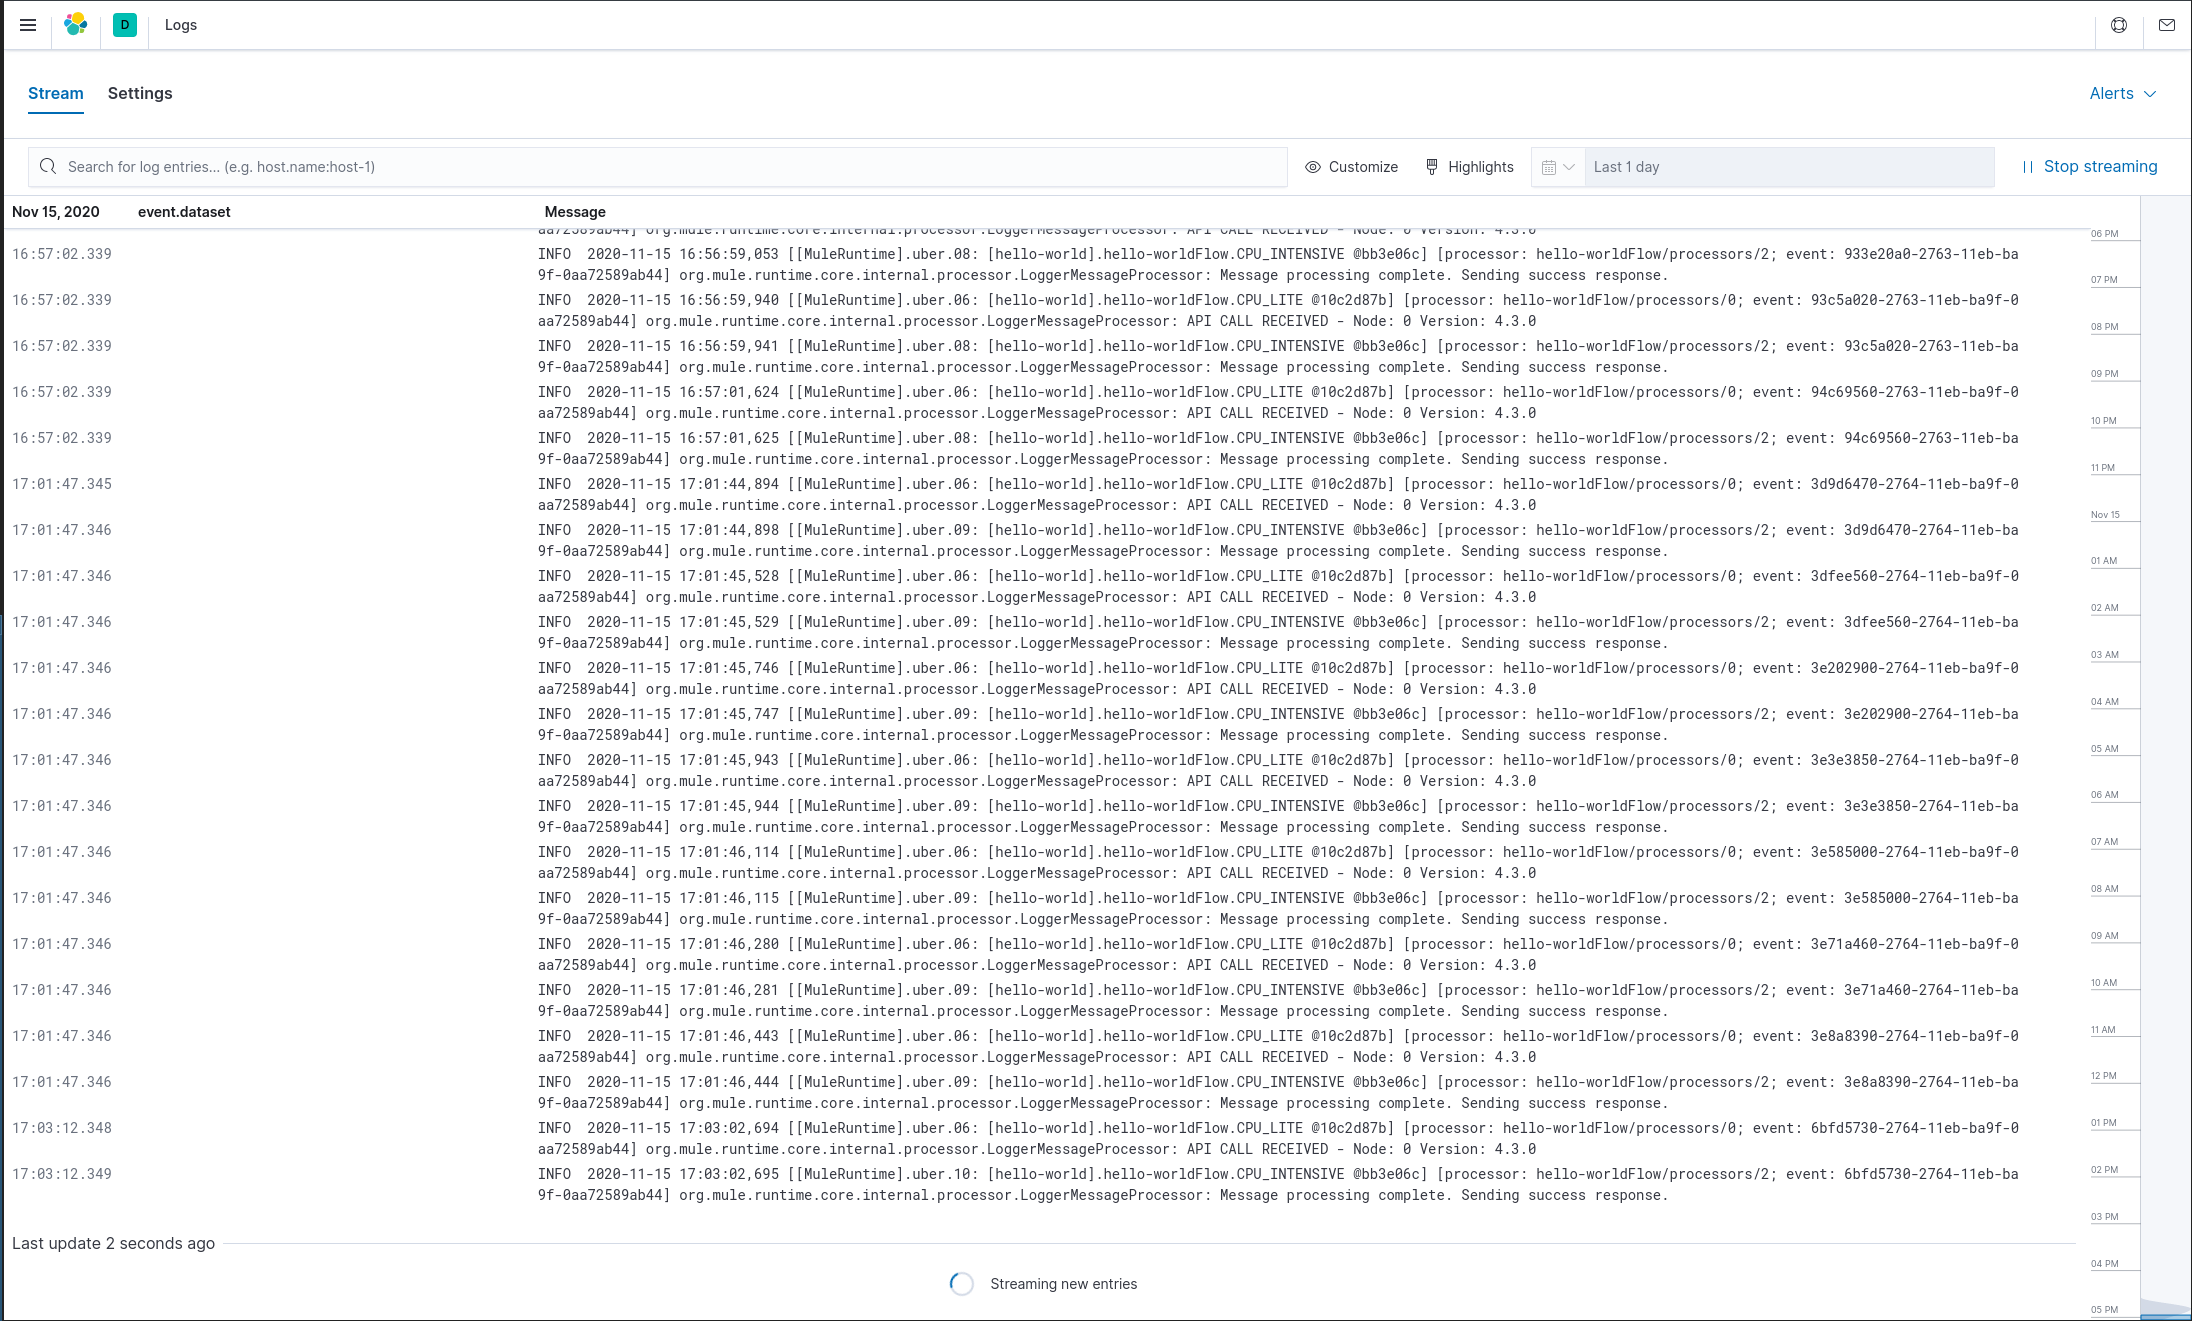
Kibana also offers the option of viewing the logs in a “Live Stream” mode which will show logs coming in in real-time. This option can be found in Observability -> Logs -> Stream Live