Mule & ELK Part 2 - Sending Mule Logs to ELK with Log4j2 (CloudHub & On-Premise)
![]()
![]()
Part 1 - Introduction to ELK Stack with Mule of this series explained what ELK is and a high level view of the options. This post will explain how to send Mule logs to ELK using Log4j2 appenders and a socket in Logstash which will work for both CloudHub and on-premise runtimes.
This post will look at how we send the logs to ELK from CloudHub using Log4j2.
Disabling Logs in CloudHub
In order to use this method, the default logs must be disabled in CloudHub. This is because CloudHub uses its own Log4j configuration which overwrites/ignores the one bundled with the app. This means for our Log4j configuration to work CloudHub’s must be disabled.
The setting can be found in the Settings of the deployed application:
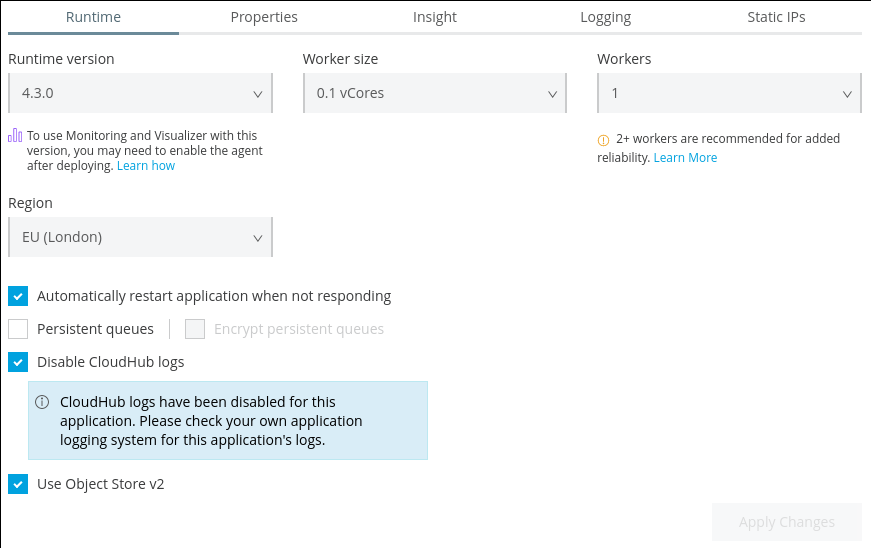
Note that although the default Logs will be disabled an Appender will be included in the custom Log4j configuration that will send the logs to CloudHub so they can still be viewed in Runtime Manager as normal.
Log4j2 Configuration
Configuring Log4j2 consists of adding an appender that sends the logs to a TCP socket and an additional appender for sending the logs to CloudHub (if desired).
The complete Log4j2 configuration can be found here.
The Appender to send logs to Logstash (edit host & port to match the Logstash deployment):
<Socket name="socket" host="localhost" port="4560" protocol="TCP">
    <JsonLayout compact="true" eventEol="true" />
</Socket>
The Appender to send logs to CloudHub:
<Log4J2CloudhubLogAppender name="CLOUDHUB"
    addressProvider="com.mulesoft.ch.logging.DefaultAggregatorAddressProvider"
    applicationContext="com.mulesoft.ch.logging.DefaultApplicationContext"
    appendRetryIntervalMs="${sys:logging.appendRetryInterval}"
    appendMaxAttempts="${sys:logging.appendMaxAttempts}"
    batchSendIntervalMs="${sys:logging.batchSendInterval}"
    batchMaxRecords="${sys:logging.batchMaxRecords}"
    memBufferMaxSize="${sys:logging.memBufferMaxSize}"
    journalMaxWriteBatchSize="${sys:logging.journalMaxBatchSize}"
    journalMaxFileSize="${sys:logging.journalMaxFileSize}"
    clientMaxPacketSize="${sys:logging.clientMaxPacketSize}"
    clientConnectTimeoutMs="${sys:logging.clientConnectTimeout}"
    clientSocketTimeoutMs="${sys:logging.clientSocketTimeout}"
    serverAddressPollIntervalMs="${sys:logging.serverAddressPollInterval}"
    serverHeartbeatSendIntervalMs="${sys:logging.serverHeartbeatSendIntervalMs}"
    statisticsPrintIntervalMs="${sys:logging.statisticsPrintIntervalMs}">
And the Appender Refs at the bottom of the file:
<AsyncRoot level="INFO">
    <AppenderRef ref="file" />
    <AppenderRef ref="CLOUDHUB" />
</AsyncRoot>
Logstash Configuration
Logstash configurations consist of 3 parts; input, filters & output (similar to an ETL tool or even integration).
The complete Logstash configuration can be found here.
The Input is where we tell Logstash where to expect messages from. We use a TCP socket (as mentioned in the log4j configuration) for our use case. This will make logstash listen on the port provided and accept new log messages sent through.
input {
  tcp {
    port => 4560
    codec => json
  }
}
The next step is the Filter stage is where we can perform transformations and massage the data as needed. In this example we are take the timeMillis field in the logs and recognise it as a date field in Unix time in milliseconds since epoch.
filter {
  date {
    match => [ "timeMillis", "UNIX_MS" ]
  }
}
Lastly, we have the Output phase which sends the data onto the Elasticsearch cluster and index as defined. The host should be configured to match the elasticsearch instance details (username & password can be configured as well).
output {
  elasticsearch {
    hosts => ["http://localhost:9200"]
    index => "mule-logs"
  }
}
Conclusion
Once the application is deployed you should then be able to see the logs appearing in Kibana.
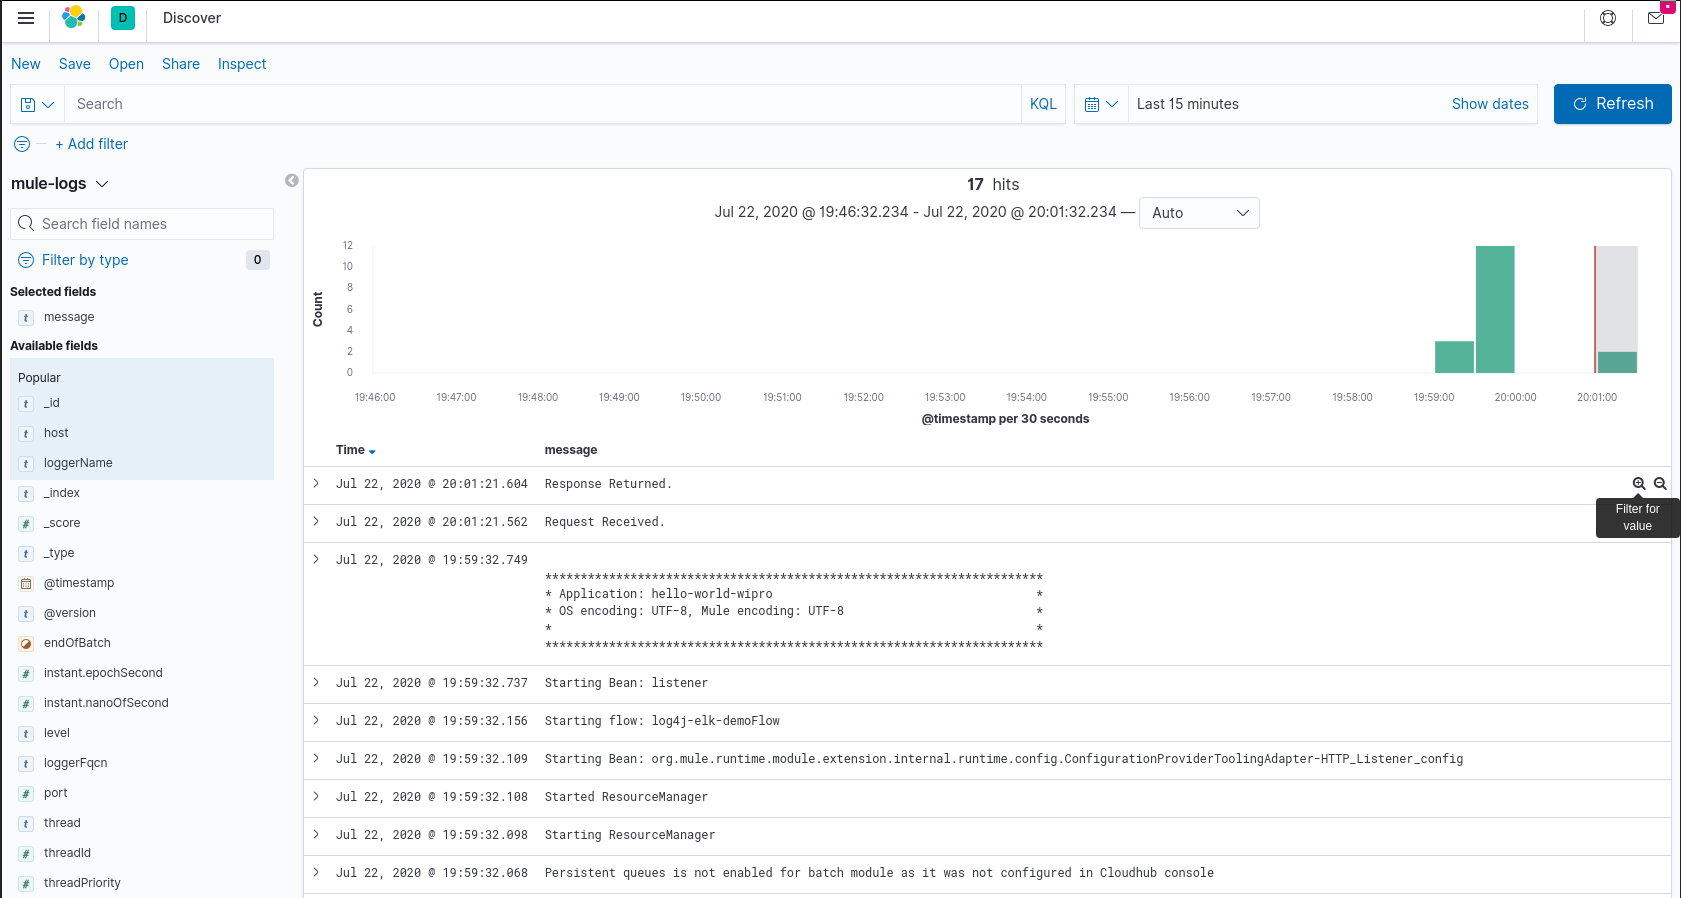
Future posts will look further into parsing the log messages and visualising them as well as how Filebeat (Part 3) could be used instead of Log4j.